 Since ancient times, mariners, architects and many others have used charts to preserve information useful for the future. If you go to a hospital, your medical information will be held in a chart– your temperature, heart rate, pills, even the things you mutter in your sleep. Nurses and doctors collect these charts and use them to track your progress over time, analyze for patterns, and protect themselves against law suits.
Stock charts give traders important information about the history and behavior of a stock. By revealing price movement, earnings announcements and volume, charts provide useable data. Traders can examine price ranges and pattern formations in when deciding which strategies to use.
If you are reading this as an options trader, I assume that you have basic knowledge of charts. The comments below address the use of charts in choosing strategies.
1. Charts reveal the personality traits of a stock.
No two stocks are the same. Each has a distinct personality profile, just like a human being. How old is the stock? Does it announce earnings regularly? Does it follow seasonal cycles? Does it shadow other stocks or indexes such as the S&P 500 ? Is it trending up, down or sideways? Does it move in a regular and predictable fashion? In ending a trend, does it bottom out like a Hawaiian beach, or like an Arctic precipice? How much does it move in response to earnings announcements? Does the chart have many gaps, and do the gaps subsequently fill? Are there clearly defined levels of support or resistance? Is it popular (how many shares trade each day)? How much does it move each week, month or year? How does the stock move as options expiration approaches? . . . many more personality traits.
I hope its clear that by “personality” we are NOT talking about the fundamentals of a stock, but the information revealed in the trading history of a stock, or its technicals. So price charts, volume numbers and advance/decline lines reveal the personality of a stock. (For more on the differences between technical and fundamental analysis, go here.)
So, how well do you know the personality of your favorite stock?
2. Charts suggest patterns traders can use to make smart strategy choices.
Options traders use stock charts to make choices about strategies. Stocks which are in a long-term uptrend attract Bull Put Spreads. Those that trade in a tight range can be candidates for Butterfly Spreads. Traders use alternating strategies such as Long Puts and Long Calls to trade a “channel”. If options premiums balloon on a stock before earnings, traders can find ways to sell that premium and collect profit from the “volatility crush”. Regular income can be generated by selling far out-of-the money puts and calls once a stock’s range is established. So many choices. We are so lucky!
3. Charts allow traders to create long term reference lines.
Using the Drawing Tools (on thinkorswim), I can draw easy-to-see lines which help me select better strategies. EXAMPLE: On this chart, you will see a “channel” (white), which sets up for “swing trading”. If I sell out-of-the-money (OTM) Puts when the stock is near the bottom of the channel, and then sell OTM Calls when it is near the top, I have a successful strategy.

In addition, I use charts to place lines indicating my positions, especially credit spreads. This PCLN chart shows a series of Bull Put Spreads which I put on as the price rose. (Green line is the credit, Red line is the insurance leg). You will notice they are $100 apart.

4. Charts guide traders toward greater profits.
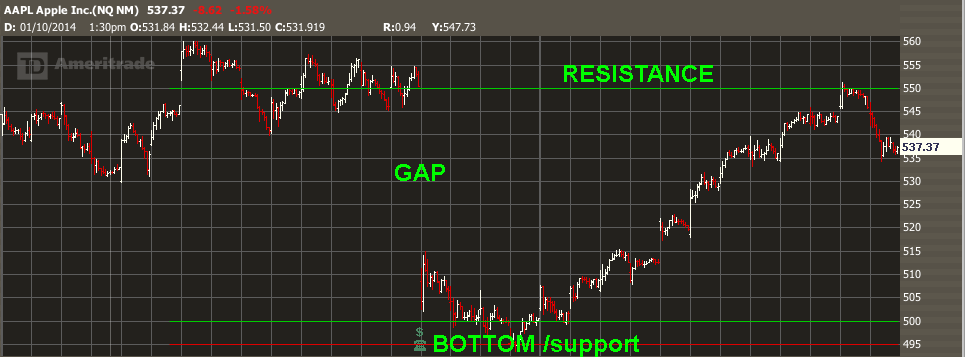
Once strategies are in place, charts can offer points of maximum profitability. This chart of AAPL recently provided a target of $550 to fill a gap because 550 represented significant resistance. In early 2014, the stock rose from $505 to 550 and we profitably closed out our position. Then the stock fell as resistance overtook momentum. The chart gave us our entry and exit numbers.
Happy charting!
“I still have a vivid memory of my excitement when I first saw a chart of the periodic table of elements. The order in the universe seemed miraculous.” Joseph Murray
Tiger says: “Don’t guess. Let the charts tell you what to do.”
=====================================================
HOMEWORK FOR HONOLULU OPTIONS TRADERS CLASS:
Time needed: one hour
1. Take a look at the one year and five year charts for five stocks, preferably ones with higher volume and higher price.
2. Using the questions from Para 1. above, describe in writing the personality of your five stocks.
3. Send in your answers to the questions below–and see you in class!
————————————
http://www.meetup.com/Honolulu-Options-Traders Don’t forget to LIKE us on Facebook.com/honoluluoptionstraders
Copyright © 2014 Graeme Sharrock and Honolulu Options Traders | All rights reserved worldwide. | P.O. Box 75343, Honolulu, HI 96836

Reblogged this on INVEST-O-MONEY.
I truly appreciate this post. I’ve been looking all over for this! Thank goodness I found it on Bing. You’ve made my day! Thanks again! ddbgdddgckad
Tee Shirts…cost of one shirt about 10 to 15 dollars, there is a certain minimum…like one dozen…most suppliers sell x 12 dozen or one hundred 44 shirts…. and to create a new logo or emblem is another couple hundred dollars to create the artwork and stencil and to imprint each shirt is another five or 10 dollars per shirt and handing charges per shirt one shirt base is say 12 dollars, if 10 shirts is divide the 300 of setup is thirty per shirt and that fourty two dollars because the quantity is small, unless someone is selling 10 dollars for standard imprint as you mentioned.